Technical Analysis
To see an equity, ETF or futures chart, click on the Underlying chart button on the toolbar.
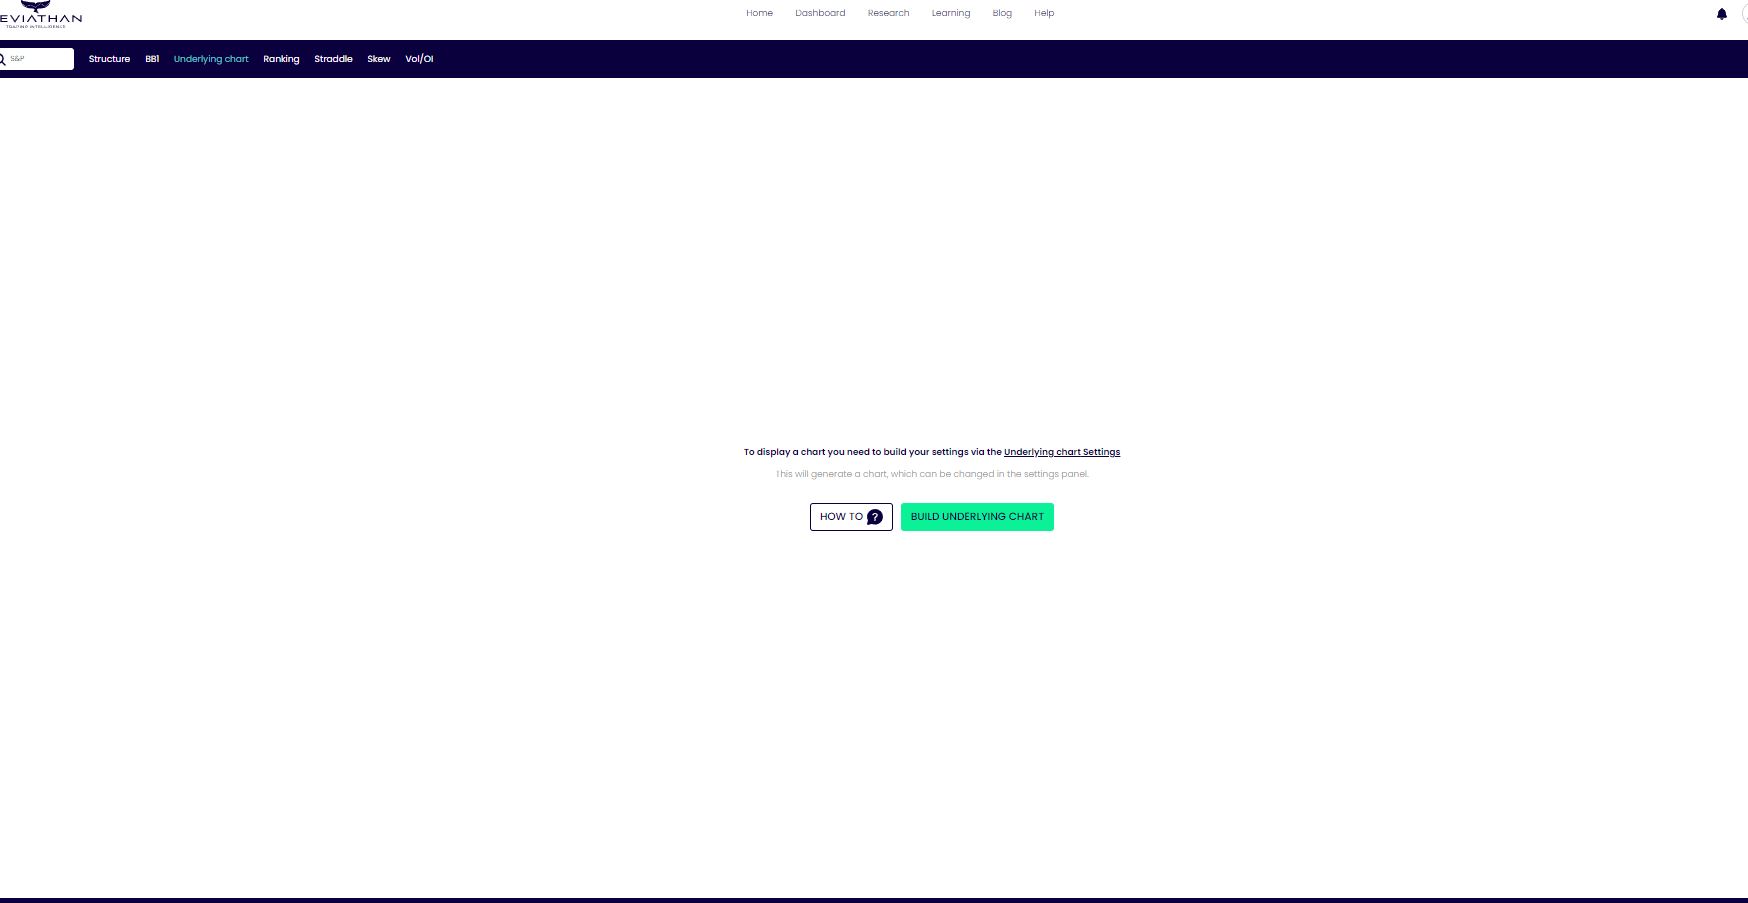
Click on the "BUILD UNDERLYING CHART" button in the middle of the page
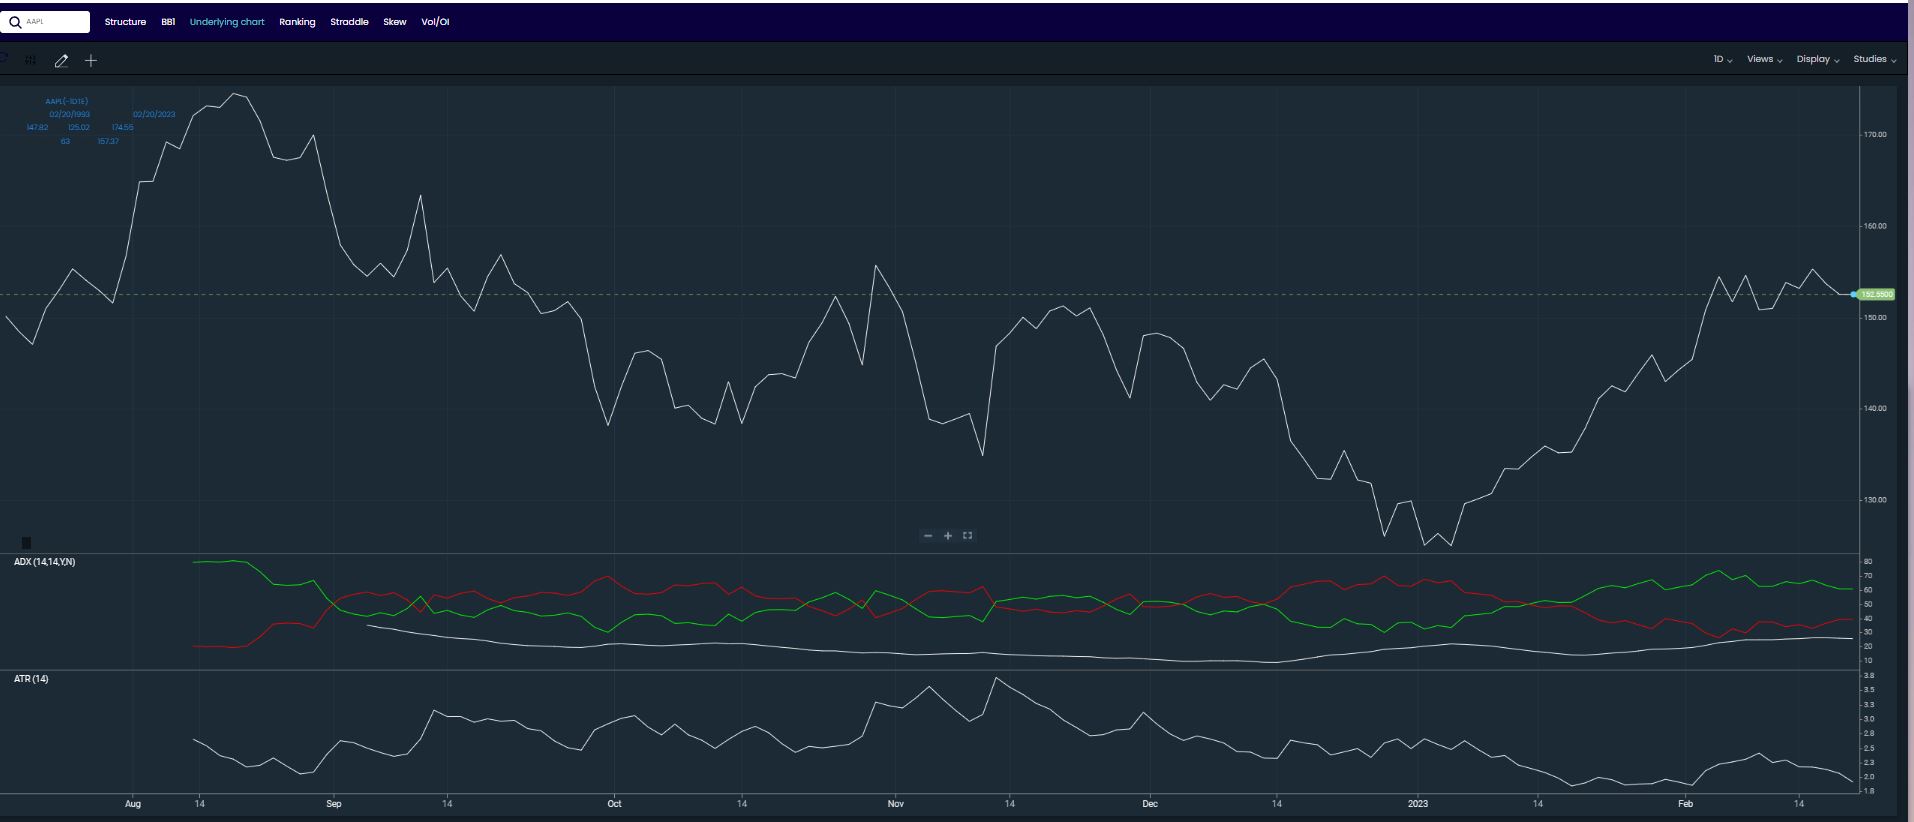
The two chart types are actual historical for an expiry or constant maturity which, specific to futures, displays a chart with the same DTE for every day going back in your desired look back period. Either click on the Future expiry button or override it with the DTE box. Then enter the time frame you desire and click Submit. It is that simple. From there you can use all of the charting functions that are also in the options LINE CHART page.